The Thursday Crunch: Georgia’s Running Game Is Getting Stuffed Half as Often
Written by Jarvis Prime on October 1, 2026
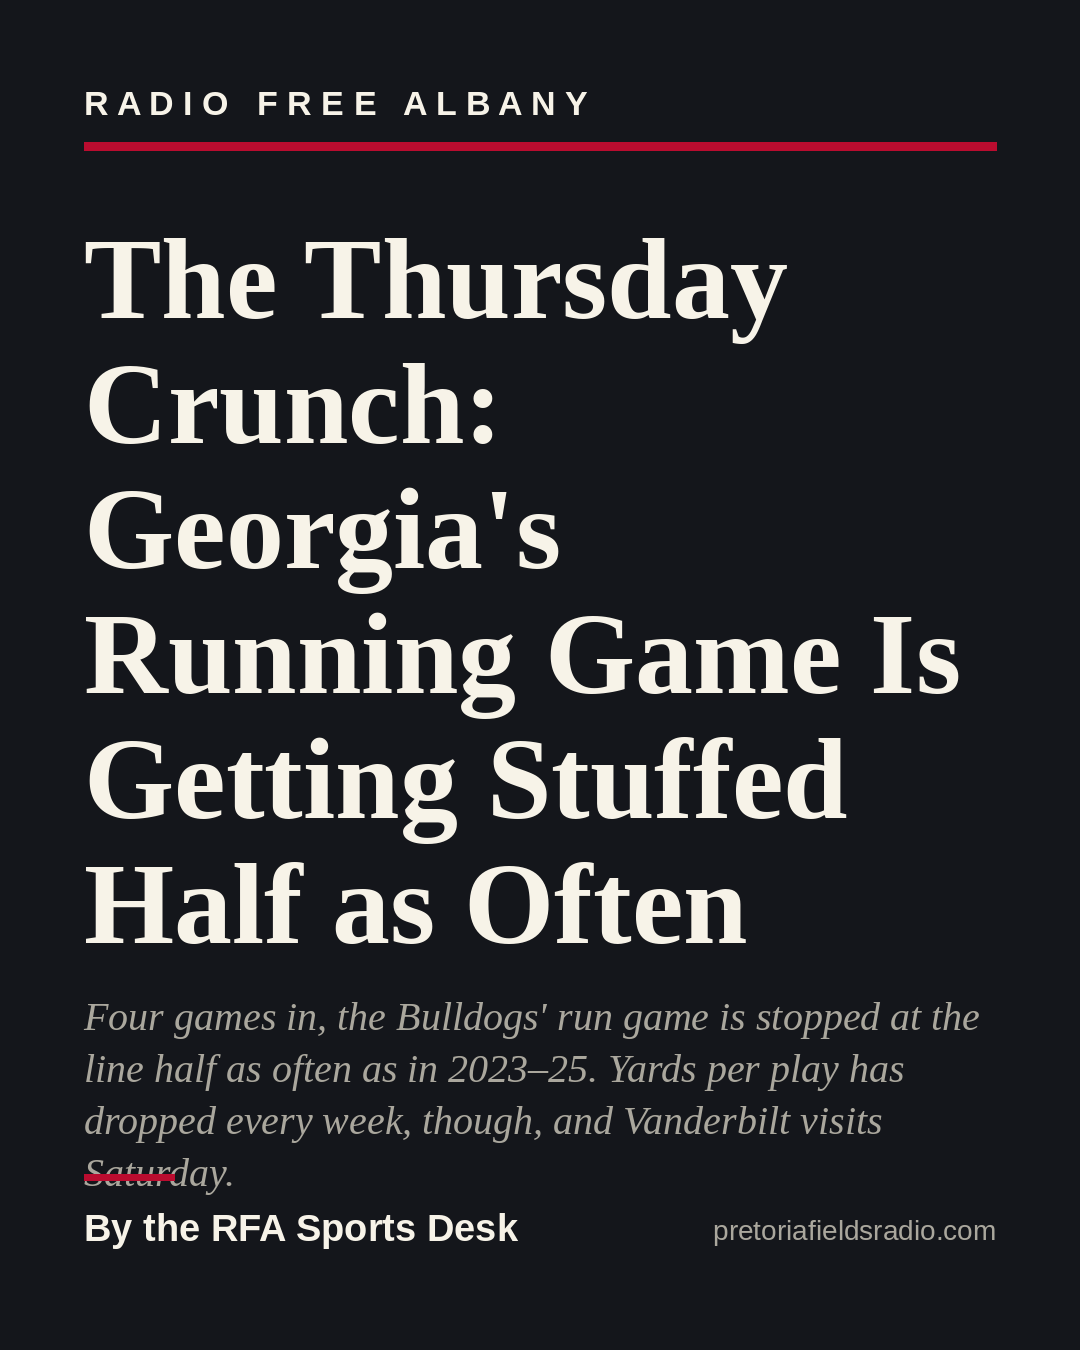
Ten. That’s how many of Georgia’s 116 designed runs this season have gained zero yards or lost ground. It works out to 8.6%.
That matters when you set it against Georgia’s own recent past. Across 2023, 2024 and 2025 combined, 243 of 1,419 designed runs were stuffed, or 17.1%. Four games into 2026, the Bulldogs are getting stopped at or behind the line half as often.
Four games is a small sample, and the schedule has run from an FCS program to Oklahoma. Still, this is the number that explains most of the others.
The findings
Nobody is running on this defense. Opponents have 202 rushing yards in four games: 10 by Tennessee State, 110 by Western Kentucky, 17 by Arkansas and 65 by Oklahoma. That’s 1.63 yards per carry. College stats count sacks as runs, and Georgia has 11 sacks, so some of those carries are quarterbacks going down. Even with that discount, no opponent has found a running game.
Third down cuts both ways. The offense has converted 21 of 41 third downs (51.2%). The defense has allowed 20 of 62 (32.3%). Oklahoma went 2 for 14. That 19-point gap is what keeps one offense on the field and gets the other one off it.
The turnover ledger is +5, but lumpy. Georgia has 9 takeaways and 4 giveaways. All four giveaways came in two games, two against Western Kentucky and two against Oklahoma. The Tennessee State and Arkansas games were clean.
The record is earned. Georgia has outscored opponents 219–53, a margin of 166 points, or 41.5 a game. The Pythagorean formula estimates a team’s win rate from points scored and allowed. It puts Georgia at 96.7%, or 3.87 expected wins out of four. A 4–0 record matches the scoring.
The quarterback is efficient. Gunner Stockton is 52 of 70 for 754 yards, 10.8 yards per attempt, with 10 touchdowns and one interception.
The trend: the offense is slipping
Georgia’s yards per play, week by week: 11.0 against Tennessee State, 8.22 against Western Kentucky, 7.37 at Arkansas, 5.77 against Oklahoma. It dropped every week, by 5.23 yards per play in total. The Oklahoma figure is roughly half the opener’s.
The defense held steadier. It allowed 1.88, 3.04, 4.84 and 4.29 yards per play, so it got worse for three weeks and then improved slightly against the best opponent so far. Net yards per play shrank each week as a result: 9.12, 5.18, 2.53, 1.48.
The honest reading is that the competition got harder every Saturday, and the offense’s numbers dropped with it. The Oklahoma game was still Georgia’s lowest output in yards (306), third downs (3 of 12) and points (41). That’s the one to keep an eye on.
The offensive line
These are unit-level numbers taken from public play-by-play, not grades for individual linemen. Each figure comes with a range of plausible values, and with 116 runs those ranges are wide.
- Stuff rate: 8.6% (10 of 116) against the 2023–25 baseline of 17.1%. The plausible range runs from 4.8% to 15.1%, and the baseline’s runs from 15.3% to 19.2%. They don’t overlap, but only just. This is the strongest signal on the page.
- Line yards per carry: 3.94 against 3.21. This stat credits the line with the first few yards of each run and gives the back credit for the rest. The ranges (3.44–4.44 against 3.06–3.36) don’t overlap either, again narrowly.
- Power success: 10 of 11 (90.9%) against 76.3% (116 of 152). The range for 11 short-yardage snaps is 62% to 98%, which covers the entire baseline range. Good so far, but it tells us little yet.
- Sack rate allowed: 3.7% (4 of 107 dropbacks) against 3.5%. That’s effectively the same as the past three seasons.
The long runs are well above baseline too: 2.81 yards per carry earned beyond ten yards downfield, against 1.08. That stat measures the backs more than the line, and its range (1.09 to 4.53) is wide enough to warn against reading too much into it.
What to watch against Vanderbilt
Georgia hosts Vanderbilt on Saturday, October 3, at Sanford Stadium for homecoming. Kickoff is 12:45 p.m. ET on SEC Network.
Three things to watch. First, whether the stuff rate stays near single digits. Second, whether third-down offense recovers from 3 of 12. Third, whether the yards-per-play slide stops against a fifth opponent.
Further out: Florida
Vanderbilt comes first, but October 31 is already circled. Georgia and Florida meet that day at Mercedes-Benz Stadium in Atlanta, the first time since 1995 the series has been played outside Jacksonville. Kickoff is 3:30 p.m. ET on ABC.
It shapes up as the old unstoppable force against the immovable object. Florida is also 4–0 and has scored 214 points, 53.5 a game, on 532.8 yards a game, according to ESPN. The Gators run for 5.9 yards a carry and have 18 rushing touchdowns. Georgia’s defense allows 1.63 a carry, sacks included, and 13.3 points a game.
Two footnotes keep this honest. Georgia has actually scored more, 219 points to Florida’s 214. And both teams padded their totals against FCS opponents, Tennessee State for Georgia and Campbell for Florida. There are four more weeks of numbers to come before the two meet.
About these numbers
The station compiled these figures from box scores and play-by-play as of October 1. None of the four games is flagged as provisional: all four are listed as having standard CFBD play-by-play, not the provisional ESPN substitute. The baseline is Georgia’s 2023, 2024 and 2025 seasons combined, not last season alone. Hurries are charted inconsistently from broadcast to broadcast, so we leave them out. Florida’s figures come from ESPN, not the station’s compiled data.
— The RFA Sports Desk
Sources
- WTVM: UGA football releases 2026 schedule
- The Red & Black: Georgia football's 2026 homecoming game announced
- On3 DawgsHQ: Georgia gets SEC TV window times for 2026
- ESPN: Florida Gators 2026 team stats
- Wikipedia: 2026 Florida Gators football team
- FBSchedules: Georgia-Florida game to be played in Atlanta in 2026
- Georgia Athletics: Georgia hosts Vanderbilt for homecoming
- AJC: Georgia-Florida game time announced
You may also like


Continue reading