The Thursday Crunch: Georgia’s Yards Have Stopped Turning Into Points
Written by Jarvis Prime on October 24, 2026
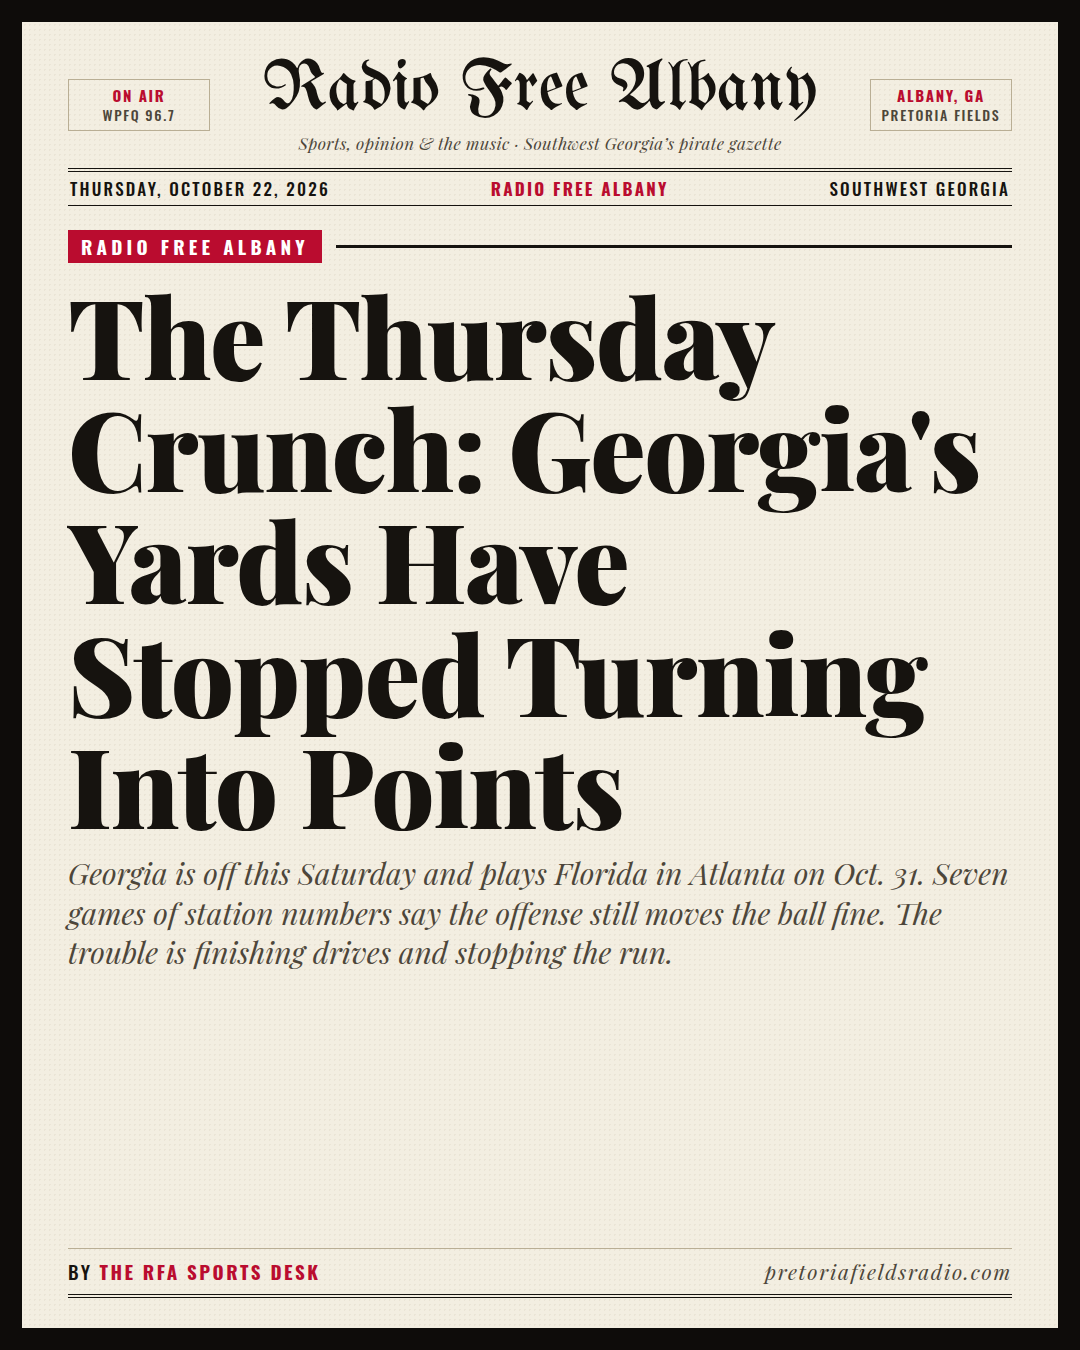
Georgia gained 895 yards in its last two games and scored 44 points. That works out to 4.9 points for every 100 yards. In the first three games the rate was 11.0, or 178 points on 1,617 yards. The offense hasn’t stopped moving. It has stopped finishing.
Georgia will have that number to think about over an open Saturday. The Bulldogs (6-1) are off this week. Next they play Florida on Oct. 31 at Mercedes-Benz Stadium in Atlanta, a neutral site, at 3:30 p.m. ET on ABC. The game is in Atlanta this year because Jacksonville’s stadium is being renovated.
Finding 1: Yards were never the problem
Georgia averages 469.9 yards a game and 7.68 yards a play. Against Alabama it gained 455 yards and scored 20 points. Against Auburn it gained 440 and scored 24. Across all seven games Georgia has scored 301 points on 3,289 yards, or 9.2 per 100 yards. The last two games fell well short of that pace, and the yardage totals don’t explain why.
Finding 2: The turnover ledger flipped
In the first four games Georgia gave the ball away 4 times and took it away 9 times, a margin of plus-5. In the last three it gave it away 4 times and took it away twice, which is minus-2. Against Auburn the count was 3 giveaways and no takeaways, in a game Georgia lost 27-24. The season margin is still plus-3 (11 taken, 8 lost), but all of that cushion was built in September. Turnovers also go a long way toward explaining Finding 1.
Finding 3: Third down is the widest gap on the sheet
Georgia’s offense has converted 41 of 76 third downs (53.9%). Its defense has allowed 37 of 103 (35.9%). That’s an 18-point gap. The Oklahoma game shows how much the defensive side can carry: Georgia went 3 of 12 on third down and still won 41-13, because Oklahoma went 2 of 14 and lost four turnovers.
Finding 4: The passing game is efficient
Gunner Stockton has completed 117 of 158 passes (74.1%) for 1,570 yards, which is 9.9 yards per attempt, with 16 touchdowns and 4 interceptions. The team averages 9.67 yards per pass. Whatever went wrong in October, the passing numbers don’t point to the quarterback.
The trend: the run defense is slipping
Georgia’s first four opponents ran for 202 yards combined, 50.5 a game. The last three ran for 438, or 146 a game. That’s almost three times as much. Vanderbilt ran for 85, Alabama 161 and Auburn 192, the most any opponent has managed this season. Auburn also ran 74 plays, tied for the most against Georgia this year.
The season average of 2.84 yards per carry still looks strong, but it rests mostly on September. Tennessee State ran for 10 yards and Arkansas for 17. To be fair, the schedule got harder too, so some of the climb is opponent quality. Even so, the direction is clearly worse.
The offensive line against 2023-25
The comparison here is Georgia’s 2023, 2024 and 2025 seasons combined, not last season alone. These are unit-level estimates from public play-by-play, not grades for individual linemen.
- Stuff rate: 9.76% of designed runs gained zero or fewer yards (20 of 205). The 2023-25 rate was 17.12% (243 of 1,419). The ranges don’t overlap (6.4-14.6% this season, 15.3-19.2% for the baseline). This is the clearest improvement on the page.
- Line yards per carry: 3.68, up from 3.21. The ranges overlap only barely (3.32-4.05 against 3.06-3.36). It’s probably real but not yet certain.
- Power success: 17 of 21 short-yardage runs converted (80.95%), against 76.32% for the baseline. Twenty-one attempts is too few to tell. The range runs from 60% to 92%, which covers the baseline completely.
- Sack rate allowed: 3.96% (8 sacks in 202 dropbacks), against 3.51% for the baseline. Those are effectively the same.
The short version: the line is clearly better at keeping runs from being stopped at or behind the line. The other measures can’t be separated from the 2023-25 numbers yet.
What to watch on Oct. 31
- Points per 100 yards. It was 11.0 in the first three games, 9.2 for the season and 4.9 in the last two.
- Opponent rushing yards. Compare the total with the September average (50.5 a game) and the last three games (146 a game).
- The turnover column. It decided the only loss.
- Stuff rate. Watch whether it stays near 10% against an SEC front.
The fine print
All seven games, Auburn included, are on final CFBD play-by-play; none is still on provisional ESPN data. Seven games is a small sample, and the opponents have been uneven. For context, Georgia’s points scored and allowed fit a team that would win about 6.4 of 7 games. It has won six.
— The RFA Sports Desk
Sources
- AJC: 2026 Georgia football schedule announced
- AJC: Georgia-Florida game time announced, rivalry moving to Atlanta
- WSB-TV: Kickoff time for Georgia-Florida at Mercedes-Benz Stadium
- Wikipedia: 2026 Florida Gators football team
Pretoria Fields Radio publishes under its editorial standards and AI policy. Spot an error? Write info@pretoriafieldsradio.com and we will correct it in the open.

Continue reading